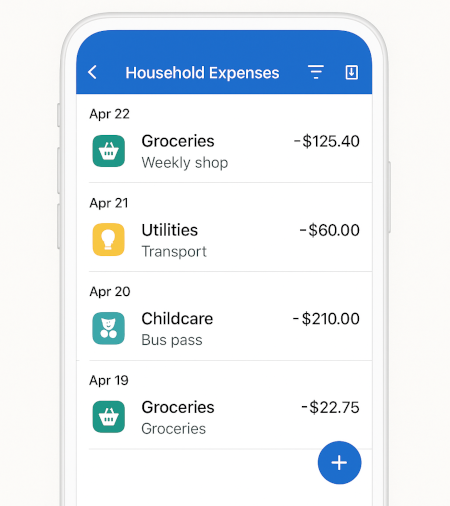
Filters & search help you answer “why?”
Drill into the transactions behind any spike. Filter by category, date range, tags, or notes to understand the story in seconds.
Fast, focused answers
Slice by category
See drivers quickly-groceries, transport, subscriptions-without manual pivots.
Search notes
Find patterns like “takeaway”, “fuel”, or “kids” to spot recurring spending.
Inspect anomalies
Jump from chart spikes to the exact transactions and fix leaks early.
Real examples of insights
Common patterns households uncover in minutes:
Subscription creep
- Identify unused apps
- Cancel or downgrade
- Reclaim €15–€40/month
Groceries pace
- Mid-month overrun warnings
- Adjust next shops
- Switch to batch cooking
Transport spikes
- Petrol surge vs last month
- Carpool or plan routes
- Track maintenance separately
Utilities seasonality
- Heating vs summer baseline
- Budget winter properly
- Reduce bill anxiety
Cash withdrawals
- Separate from card spend
- Spot untracked cash usage
- Add quick notes for context
Weekend vs weekday
- Higher dine-out on weekends
- Set a cap
- Shift one meal to home cooking
Who this works best for
Busy families
Monitor categories that swing with the calendar-childcare, holidays, utilities-and spot early overspend before it snowballs.
Solo households
Keep a steady baseline and tighten where it counts. Use comparisons to confirm progress month by month.
Side-hustlers
Separate work-related costs from home spend, track trends, and prepare clean CSV exports for tax season.
GoTaskhub Analytics vs spreadsheets
| Feature | GoTaskhub Home Analytics | Spreadsheets |
|---|---|---|
| Trend lines | Automatic from your entries | Manual formulas and charts |
| Category breakdowns | Built-in with drill-down | Pivot tables to maintain |
| Comparisons | Period vs period in one click | Custom ranges and lookups |
| CSV portability | Clean structure, stable columns | Prone to column drift over time |
| Speed to insight | Minutes, no setup | Hours of template wrangling |
Pros & cons of GoTaskhub Analytics
Pros
- Clear, fast insights with minimal setup
- Drill-down from charts to real transactions
- CSV export keeps data portable and auditable
- Works seamlessly with Budgets, Expenses, Goals
Cons
- Insights are only as good as your logging habit
- Advanced comparisons are Pro features
Security & privacy
Permissions
Invite a partner with view or edit access. Each workspace is permissioned so your household stays in control of who sees what.
Data ownership & backups
Export your analytics data to CSV anytime for backups or deeper analysis. No lock-in - your history is yours to keep and move.
Glossary
- Trend line
- A chart line that shows how spending changes over time.
- Category share
- The percentage of total spend attributed to a category.
- Period comparison
- Analysing one date range against another (e.g., this month vs last).
- Drill-down
- Jumping from a chart to the underlying transactions for detail.
- Export (CSV)
- A file you can open in spreadsheets to audit, share, or build pivots with stable columns.
- Pace
- How quickly you’re spending relative to the time left in the month.
Exports that stay clean month to month
When you need deeper analysis or to share a snapshot, export a clean CSV with stable columns so pivots don’t break and audits are painless. Own your data - no lock-in.