Business Analytics that reflect reality - not theory
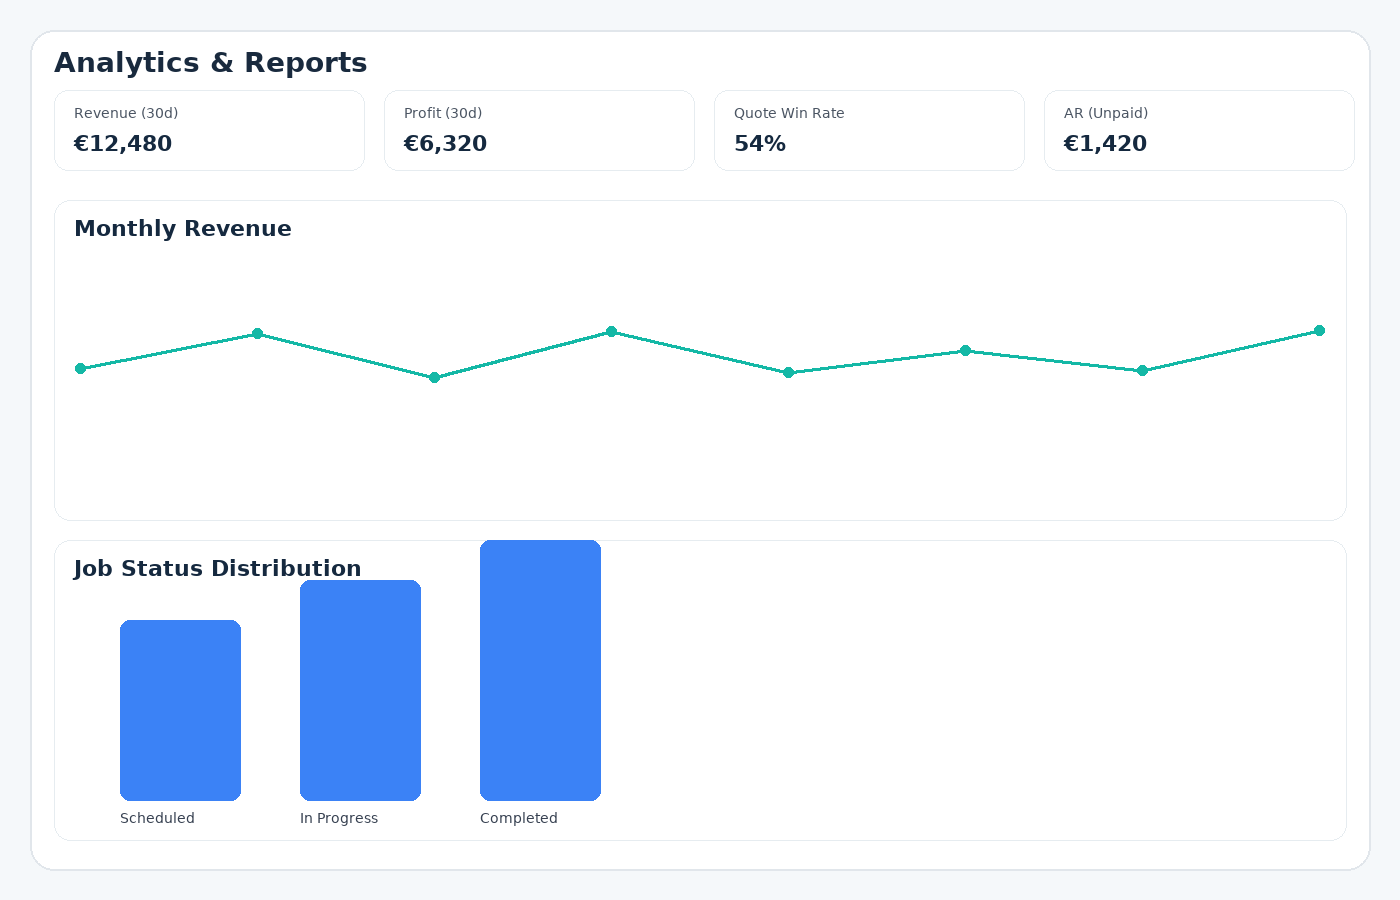
GoTaskhub Business Analytics gives you the trustworthy numbers pulled straight from your daily work - quotes, invoices, payments, and (optionally) expenses. No spreadsheets, no custom SQL, no guesswork. Just crisp views of revenue paid, what’s owed,how long it’s been owed, and the timing between what you issued versus what you collected.
Why it worksFocused KPIs that map 1:1 to your actual records - easy to trust, easy to act on.
OutcomeSpot bottlenecks, prioritise follow-up, and plan cashflow without leaving your flow.
Revenue (paid)
Only settled invoices - real income you can rely on.
AR & Overdue
Outstanding and late amounts, always in context.
Issued vs Collected
See the cash-timing gap by month.
Revenue (paid): recognised income you can rely on
- Uses settled invoices only - no projections or pending amounts.
- Compare months/quarters without mixing in “theoretical totals”.
- Export issued totals separately if you want to model pipeline.
Accounts Receivable & Overdue: what’s owed and where to act
Use AR/Overdue to prioritise collections and improve time-to-cash.
When AR rises
- Tighten terms or use deposits for larger jobs
- Introduce earlier reminders
When Overdue spikes
- Switch focus to collections
- Escalate cadence or late-fee policy
Aged receivables: Under 30 / 30–60 / 60–90 / 90+
Standard buckets your bookkeeper already uses - no translation needed.
Tailor reminders/terms by bucket; escalate past 60–90 as needed.
Tailor reminders/terms by bucket; escalate past 60–90 as needed.
Tailor reminders/terms by bucket; escalate past 60–90 as needed.
Tailor reminders/terms by bucket; escalate past 60–90 as needed.
Issued vs Collected: understand cash timing
Compare created invoices with payments received per month to see the lag.
- Test deposits, “pay now” links, or faster send - then measure the gap shrink.
- Plan buffers for typical 30/45/60-day collection patterns.
P&L snapshot (with Expenses enabled on Starter/Pro)
A simple period view: paid revenue minus tracked expenses. Keep it light in-app; export if you need deeper accounting treatment.
Heads up: P&L snapshot appears when Expenses is enabled (Starter/Pro).
Quote conversion & Top customers
Quote conversion
Track created vs accepted; diagnose pricing/packaging vs top-of-funnel issues.
Top customers
Identify key accounts to prioritise; recalibrate terms if they appear in aging often.
Export the data
Export invoices, quotes, and expenses as CSV/XLSX for audits, models, and sharing with advisors. Exports use the same underlying data as the dashboard - no conflicting reports.
- Hand off directly to your bookkeeper
- Build one-off models in Sheets/Excel
- Archive snapshots for board or client updates
Practical workflows
Collections rhythm
Review AR/Overdue every Monday. If 60–90 is growing, call those customers first.
Cash planning
Use Issued vs Collected to size buffer days. Test deposits or faster send and re-check next month.
Customer focus
Use Top customers for proactive check-ins and pilots. Adjust terms if they appear in aging.
Clarity
Paid means paid - definitions are explicit and consistent.
Speed
Lean UI, instant ranges, focused KPIs.
Trust
Same data powers exports; easy to audit and share.